Testing Alternate Response Models of Grassy Ecosystems
(Part Two)
Welcome to part two of my research project. If you got through part one, and you're here, then well done, you must be a sucker for punishment.
Introduction
Unlike the savannas of Africa or steppes of Asia and North America, Australian ecosystems did not experience heavy grazing by ungulate herbivores before European settlement (Mack and Thompson 1982). Intense exposure to ungulates and farming practices since settlement has caused dramatic impacts on vegetation composition and function of grassy ecosystems (Lunt et al. 2007a). Australia’s temperate woodlands differ from other temperare ecosystems worldwide in that most of the latter are either treeless steppes, extensions of subtropical savannas or forests dominated by conifers or broad-leaf deciduous trees (Whittaker 1975).
Livestock exclusion is a major tool to restore vegetation in agricultural landscapes of Australia (Prober et al. 2011b), China (Su et al. 2015), northern Sinai (El-Bana et al. 2003), north America (Yeo 2005), Saudi Arabia (Al-Rowaily et al. 2015) and Argentina (KrÖPfl et al. 2013), and is often the first step in restoring ecosystems degraded by farming. Many government and industry-sponsored projects provide incentives to landholders to fence remnants to exclude stock and improve ecological condition. Yet the ecological outcomes of these programmes have not been widely evaluated.
Some Australian studies of fencing responses have shown greater tree recruitment, increased cover of native perennial grasses, increases in native species richness, reduced cover of exotic annual species and reduced soil surface compaction at fenced sites relative to unfenced sites (Prober et al. 2011b; Spooner et al. 2002). Conversely, recovery is not assured and sites can remain in a steady degraded state (Spooner et al. 2002; Yates and Hobbs 1997). The failure of many restoration projects to initiate spontaneous recovery suggests that fencing alone may not be enough to initiate such change (Price et al. 2010; Spooner et al. 2002; Yates and Hobbs 1997). Slow recovery or transition to undesirable states could suggest intrinsic site problems or legacies generated by earlier farming practices. State and transition models have highlighted grazing-induced changes that may be irreversible if ecological thresholds for recovery have been crossed (Prober et al. 2002b; Spooner and Allcock 2006; Whalley 1994; Yates and Hobbs 1997; Yates et al. 2000). Identification of ecological barriers to recovery is critical for restoration of degraded remnants (Spooner and Allcock 2006), and until these are recognised and ameliorated, successful natural regeneration will remain highly uncertain and resource exhaustive.
To elucidate generalisations about fencing as a management tool for woodland restoration, four alternate response types for ungulate exclusion may be summarised from the scientific literature on Australian temperate grassy ecosystems:
Recovery Model - with time since livestock exclusion, there are increases in diversity and abundance of native groundcover species that had been lost or reduced in abundance during grazing;
Competitive Exclusion Model - with time since livestock exclusion, there are increases in abundance of dominant groundcover species which suppress other species, reducing overall plant diversity;
Null Model - with time since livestock exclusion, there is no compositional shift and no increase in species diversity or abundance of groundcovers; and
Woody Encroachment Model - with time since livestock exclusion, there are increases in woody plant abundance that suppress ground cover plants, reducing ground cover species diversity.
For all hypotheses, changes in vegetation may be expected to be detectable over periods of years to decades, with ground layer structure expected to respond more rapidly than woody structure and species composition.
These response types may be elaborated in four candidate response models that have been identified from grazing studies and described below.
Recovery Model: increase in diversity and abundance of native ground plants that were reduced in abundance or lost during grazing
This is an equilibrium model that predicts a simple reversibility response, in which a system returns to its pre-grazing state after removal of herbivores. It assumes that no thresholds are crossed and that the degradation pressure associated with grazing was weak or short-term. This response has been hypothesised across productivity gradients that have undergone low levels of degradation by grazing. On nutrient poor soils, for example, Yates and Hobbs (1997) found mildly degradation of Salmon Gum woodlands could be reversed if complete or near complete removal of grazing occurred. Prober et al. (2011b) found fenced York Gum woodlands were more similar in native species richness to benchmark woodlands than unfenced woodlands. Price et al. (2010) found a recovery of native species lost during grazing in River Red Gum woodlands of Victoria, while observations by Pettit et al. (1995) in nutrient poor Jarrah woodland of south-western Australia are broadly in support. Native understorey species richness returned to similar levels measured at ungrazed sites within three years of exclusion from variable grazing intensity and six years after intensive livestock grazing (Pettit and Froend 2001). However, the re-establishment of vegetation cover appeared to take longer (Pettit and Froend 2001). Lunt et al. (2007b) predicted that return of high native diversity after exclusion of grazing was more likely to occur on low productivity sites than high productivity sites. Lunt’s prediction appears to be supported by Gibson and Kirkpatrick (1989), who found that a return of understorey species richness was negatively correlated with productivity following grazing exclusion in Tasmanian alpine grassy ecosystems. Conversely, others predict that reversal responses to grazing exclusion may occur on high-productivity sites (e.g. Spooner and Allcock (2006)). Consistent with this, Wahren et al. (1994) recorded substantial increases in a number of tall, palatable forbs and short, palatable shrubs after long-term (48 years) livestock exclusion on fertile and highly organic soils of subalpine grasslands of the Victorian Alps. The Recovery Model predicts the system returns to its pre-grazing state after removal of herbivore grazing.
Competitive Exclusion Model: increase in abundance of dominant ground plants which outcompete other species, reducing plant diversity.
This model predicts that a reduction in disturbance associated with grazing results in a decrease in species richness due to rapid growth rates of dominant plants allowing competitive exclusion to occur. More broadly, this conforms with Huston (1979) hypothesis that when reductions in biomass become less frequent, population growth rates of competitors increase, resulting in decreased diversity through the exclusion of weak competitors. This model has empirical support, mainly from high-productivity habitats, as proposed by Schultz et al. (2011) and Lunt et al. (2007b) for high-productivity habitats (cf. low productivity habitats, Recovery Model). Support for this model comes from several studies, including that of Tremont (1994), who recorded lower species diversity after 16 years of exclusion from sheep grazing in temperate grasslands on rich basaltic soils. The Competitive Exclusion Model predicts a reduction in species diversity due to exclusion of small taxa (i.e. small forb species that inhabit the inter-tussock niche) after removal of herbivores.
Null Model: no compositional shift and no increase in species richness of groundcovers
Under this model, the grazed system shows limited recovery after fencingand no change occurs to species richness with grazing exclusion. Consistent with this null hypothesis, Schultz et al. (2014) found no evidence of competitive exclusion by the dominant grasses, no establishment of species that were not recorded in grazed control plots and no directional shift in composition after 2.5 years of livestock exclusion from native grasslands dominated by warm-season perennial grasses on the North West Slopes of NSW. A crucial limitation of Schultz’s study is the short timeframe over which responses to herbivore exclusion were measured. Nonetheless, responses of understorey vegetation to livestock exclusion may be delayed or inhibited by positive feedbacks between soil nutrient cycling and understorey composition (Prober et al. 2002b). The Null Model predicts no change in species richness or composition, and that the system maintains a stable state after grazing exclusion.
Woody Encroachment Model: dense woody plant recruitment outcompetes understorey plants for resources and reduces species diversity.
This model predicts an increase in woody plant recruitment following livestock removal. As woody plant density increases understorey species richness decreases due to competitive interactions. Consequently, a negative relationship forms between woody plant cover and understorey species diversity. Dense native tree or shrub regeneration has been observed across various regions of Australia following the removal of livestock grazing. In rangelands of central NSW, the exclusion of livestock from Poplar Box (Eucalyptus populnea) woodlands saw an increase in shrub density after rainfall (Harrington et al. 1976; Hodgkinson 1976; Tunstall et al. 1981). The removal of sheep grazing in River Red Gum (Eucalyptus camaldulensis) woodlands of Victoria resulted in increased woody-plant cover (Price and Morgan 2009). It has been shown that mature trees may suppress understorey vegetation by depriving it of resources (Connell and Slatyer 1977; Prober et al. 2002a; Yates et al. 1994). In a study of box-ironbark woodlands of Victoria, elevated stem densities (compared against benchmarks) were associated with reduced cover of native and exotic understorey plants (Jones et al. 2015). The Woody Encroachment Model predicts a recruitment of dense woody cover that outcompetes groundcover species, reducing overall species richness.
This study aims to test support for each of the four vegetation response models described above by examining the responses of degraded grassy woodlands to livestock removal.
If the Recovery Model holds, native species richness and summed frequencies are expected to increase with time since treatment in fenced relative to unfenced vegetation.
If Competitive Exclusion Model holds, dominant grass species are expected to increase in abundance, smaller inter-tussock species are expected to decline in abundance and richness as time since fencing increases; rank-abundance curves are expected to be steeper and shorter in fenced than unfenced vegetation and become more so with time since treatment.
If the Null Model holds, no changes in species richness, composition or abundance are expected with time since treatment in both fenced & unfenced vegetation.
Finally, if the Woody Encroachment Model holds, woody species are expected to increase in abundance faster in fenced than unfenced treatments and abundance and diversity of groundcover species are expected to decrease faster in fenced than unfenced treatments.
These alternative predictions were tested using a set of paired fenced and unfenced plots that spanned a chronosequence of fencing treatments 1 – 17 years of age.
Methods
Experimental design
The study used cross-fence line contrasts of paired plots at 14 sites. Each site consists of a fenced plot excluding livestock grazing (treatment plot) and an unfenced plot being actively grazed by livestock (control plot). Paired plots were located within 100 metres of each other, more than 5 metres from fence lines, and matched as closely as possible in dominant tree species, structure, aspect, slope, topographic position and land management history. Strict selection criteria were developed to minimise the constraints of a space-for-time (SFT) comparative study and limit any non-treatment differences between plots within each pair (Pickett 1989). The criteria ensured that control plots and treatment plots shared a common initial state. That is, each site shared similar grazing history; the control plot maintained a similar grazing regime and intensity to that of the treatment plot before it was destocked.
Landholder Interviews and Selection Criteria
Informal landholder interviews (described in (Briggs et al. 2008; Prober et al. 2011a) were the first means of further prioritising candidate sites. The aim of the interview was to gain an appreciation of the level and consistency of grazing pressure imposed on the vegetation prior to retirement and vegetation in actively grazed paddocks. Landholders were asked about the number, type of animal and grazing frequency. This allowed a standardised stocking rate of dry sheep equivalent (DSE) per unit area (hectares) to be estimated for each paddock. Estimating stocking rates of paddocks gave insight into whether grazing histories matched across the fence-line.
Quantitative stocking rates were classified into four broad qualitative grazing intensity classes: negligible/nil (0-0.1 DSE), light (1.5 DSE), moderate (3.5 DSE) and heavy (5 DSE). Grazing intensity classes were based on carrying capacity estimation of the land, as well as landholder opinion. For example, a DSE of 5 on highly productive soils would impose a lower grazing pressure than if the same DSE of 5 was applied to low productive soils.
Below is the list of landholder interview questions.
What are the dominant trees and understorey cover?
What type of stock do you run?
How long has the paddock been retired for?
What was the stocking rate (dry sheep equivalents (DSE)) and grazing technique (set stocked, rotational) of the retired paddock?
Is there another paddock that is still being actively grazed nearby with a similar grazing history to that described in question 4?
Has grazing pressure been consistent of the grazed paddock since retirement of the destocked paddock?
A site reconnaissance was scheduled if a property had the following attributes:
A canopy (or evidence of) dominated by White Box, Yellow Box or Blakely’s Red Gum, with a grassy understorey.
A retired paddock between 1 and 20 years.
A nearby actively grazed paddock sharing similar habitat and landscape position to the retired paddock.
Similar stocking rates on both the grazed and retired paddock.
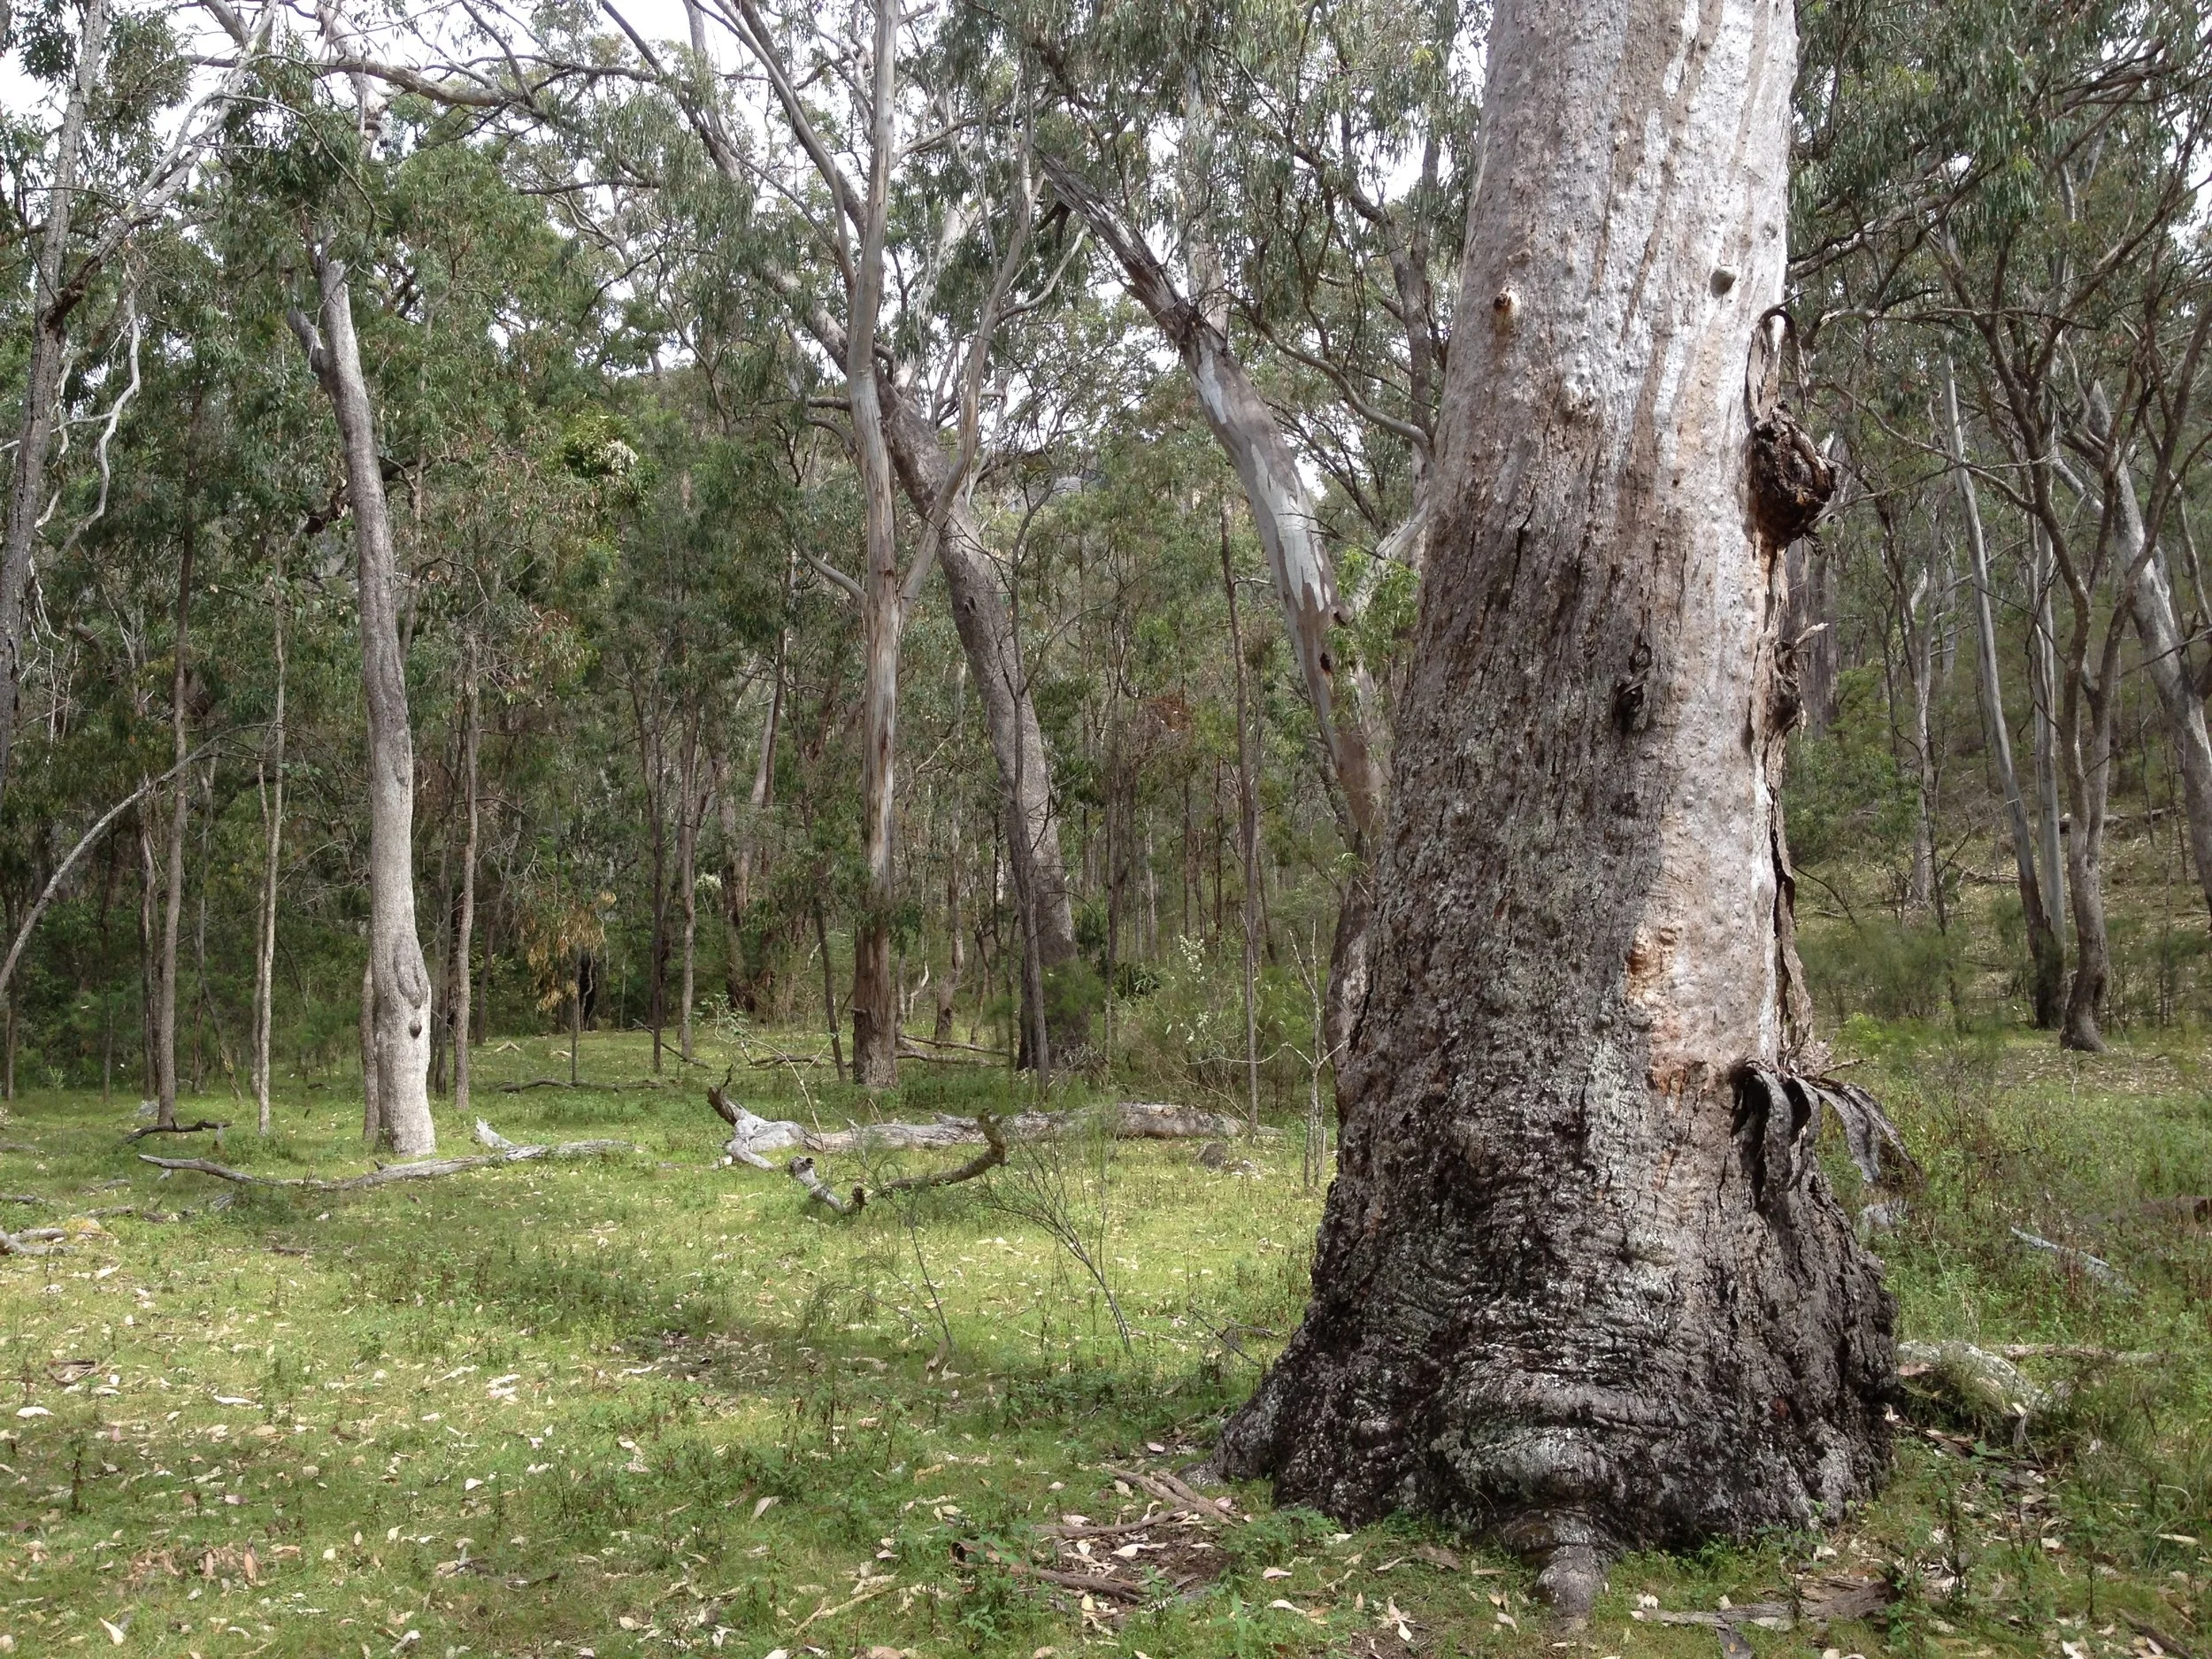
Study Area and Study System
The study area covers the Central West and the western parts of Hunter-Central Rivers and Hawkesbury Nepean Catchments of NSW, Australia (Figure 1). The study area is characterised by steep hills in the east, and gently undulating landscapes and alluvial river plains, mostly in the west. Soils are derived from parent materials that range from highly fertile alluvials and basalts to sandy loams on granite intrusions and deep sands of the Pilliga sandstones. Rainfall is relatively evenly distributed throughout the year and ranges from 550 to 900 mm per year, declining from east to west.
The study system closely matches the legal definition of box gum woodland and derived native grassland listed under the National Environment Protection and Biodiversity Conservation Act 1999 and NSW Threatened Species Conservation Act 1995. Prior to European settlement grassy box woodlands formed an almost continuous band covering several million hectares on the slopes and tablelands of Victoria, NSW and southern Queensland (Beadle 1981). The community’s occurrence on productive soils, has led to extensive clearing for agriculture and modification for livestock grazing. It has been estimated that 93% of its original extent has been cleared in NSW (Department of Environment Climate Change and Water NSW 2010), and is poorly conserved in the national conservation reserve system (Specht 1981; Yates and Hobbs 1999).
The predominant tree canopy comprises White Box (Eucalyptus albens), Yellow Box (Eucalyptus melliodora) and/ or Blakely’s Red Gum (Eucalyptus blakelyi). The latter two species become locally dominant along non-permanent watercourses or on deeper soils of valley (Moore 1953). Shrubs are generally sparse or absent, though they may be locally common. The trees form an open canopy above a rich diversity of graminoids and herbs (Prober and Thiele 1993). The community becomes shrubbier on poorer, shallower soils (Prober 1996).

Figure 1. Study Area
Environmental site attribute data (slope, aspect and landscape position) were collected during sampling. Other environmental variables were interrogated from public databases using geographical information systems (GIS) including geology, elevation and climate (temperature, rainfall etc.) Gridded climate modelling by the Bureau of Meteorology (BOM) was used to describe broad climatic conditions of each site. This included seasonality of rainfall, annual average minimum and maximum temperature and annual average rainfall.
Sampling
Sampling was undertaken over six field survey campaigns between 28 January to 30 April 2015. Paired plots were located as close together as possible and stratified both temporally and spatially. Sample sites were grouped into four age classes. Age classes were based on livestock exclusion time (in years) of fenced plot. The four age classes were 0-4, 5-9, 10-14 and 15-19 years of livestock exclusion. Stratification ensured a minimum of 3 sample sites per age class. To mitigate any effect of sampling effort across age classes and time taken to complete sampling, a maximum of two sample sites in any one age class in one region were sampled during any one survey campaign (Figure 1).
Floristic Surveys
To identify changes in vegetation composition and measure species richness, floristic surveys were undertaken at the 14 sites, each of which included a fenced and unfenced plot (28 plots in total). The dimensions of each plot were 20 metres x 20 metres (400 m2). To control variability whilst avoiding selection bias, fenced and unfenced plots were randomly located within a common domain matched as closely as possible in dominant tree species, structure, aspect, slope, topographic position and land management. Paired plots were located within 150 metres of each other. A handheld geographical positioning system (GPS) was used to record the coordinates of a quadrat corner.
Twenty, 1 m2 quadrats were randomly located within each plot. All vascular plant species observed rooting within the bounds of the quadrat were identified to species-level, or genus-level for nonflowering monocots. When a species could not be positively identified in the field, samples were taken for later identification. Presence records of each taxon was tallied across the 20 quadrats to give a frequency score (i.e. if a plant was observed in 5 quadrats, irrespective of density, it was awarded 5). Plant species not captured 1 m2 quadrats, but observed growing in the 400 m2 plot were given a nominal score of 0.1 out of 20.
Floristic sampling was undertaken from 28th of January to the 19th March 2015.
Vegetation Structure
A count of each woody plant species was recorded within the same 400 m2 plots. At sites with very high woody stem densities, counts were undertaken within two 100m2 (10m x 10m) subplots and mean counts were extrapolated across the entire 400 m2 plot. Trees were tallied according to seven size classes: < 1 m high; 1-2 m high; > 2 m high < 10 cm diameter at breast height (DBH); 10-20 cm DBH; 20-50 cm DBH; 50-100 cm DBH; and >100 cm DBH.
Data Analysis
To assess evidence in support of the Recovery Model the difference among fenced and unfenced plots in native species richness and summed frequencies (abundance) of native species were evaluated as a function of fencing age using simple linear regression models.
To assess evidence in support of the Competitive Exclusion Model, linear regressions were first used to test the relationships between fencing age and: i) changes in abundance of dominant grass species; and ii) changes in inter-tussock species diversity. Relationships between changes in dominant grass abundance and changes inter-tussock species richness were then tested using simple linear models. Fencing-related changes in both dominant grasses and inter-tussock species were calculated from the difference between fenced and unfenced plots. Dominant grasses were considered any grass with an initial (unfenced) frequency score of at least 10 out of 20, while inter-tussock species included forbs, ferns, sedges and creepers. Species rank abundance curves were calculated for fenced plots and unfenced plots to compare the effects of fencing on species richness and evenness.
To assess evidence in support of the Null Model, differences among fenced and unfenced plots in species richness, species abundance and species composition were evaluated as a function of fencing age using simple linear regression models. For each analysis the data were separated into three different datasets (native composition, exotic composition and combined). Bray-Curtis dissimilarities were calculated for each of the 28 plots using the “vegan” package (Oksanen et al. 2015) in R (R Core Team 2016). The difference in Bray-Curtis dissimilarities between fenced and unfenced plots were fitted to simple linear regression models as a function of fencing age. Bray-Curtis was used because it places more weight on species that have high abundances than species with low abundances in those samples. Samples that share the same species in high abundance are more likely to be ecologically similar than samples that share the same species in low abundance. Hence, Bray-Curtis is likely to reflect ecological relationships more faithfully when examining compositional divergence of fenced from unfenced plots.
To assess evidence to support the Woody Encroachment Model, the difference in woody plant density (per 400 m2) and groundcover richness between fenced and unfenced plots as a function of fencing age were fitted using simple linear models.
All models were evaluated by checking plots of the residuals and transforming where necessary in R v.3.2.3 (R Core Team 2016).
Results
Recovery Model
Linear regression revealed no relationship between fencing age and fenced/unfenced differences in either in native species abundance (R2 = 0.033, P = 0.537) or native species richness (R2 = 0.066, P = 0.375) (Figures 2 and 3). However, native species richness and abundance generally increased as a result of livestock exclusion fencing.
These results are inconsistent with the Recovery Model predictions and do not support equilibrium model concepts.

Figure 2. Different in native species abundance between fenced and unfenced Figure 3. Difference in native species richness between fenced and unfenced plotsplots with fencing age with fencing age
Competitive Exclusion Model
No relationship was found between fencing age and fenced/unfenced differences in either dominant grass abundance (R2 = 0.197, P = 0.112) or inter-tussock plant richness (R2 = 0.049, P = 0.446). No trend was found between inter-tussock plant abundance and fencing age (R2 = 0.170, P = 0.143).
No trend was found in pairwise differences between fenced and unfenced plots for inter-tussock plant richness or abundance and dominant grass abundance (R2 = 0.025, P = 0.586 and R2 = 0. 177, P = 0.168, Figure 4).
These results are inconsistent with Competitive Exclusion Model predictions.

Figure 4. Difference in dominant grass abundance and inter-tussock plant abundance between fenced and unfenced plots
Null Model
No relationship was found between fenced/unfenced differences in native species richness (R2 = 0.066, P = 0.375), exotic species richness (R2 = 0.0002, P = 0.962) or combined species richness (R2 = 0.071, P = 0.357) with fencing age (Figure 3, 5 and 6, respectively). However, native species richness generally increased as a result of livestock exclusion fencing
No relationship was found between fenced/unfenced differences in native species abundance (R2 = 0.026, P = 0.579), exotic species abundance (R2 = 0.218, P = 0.092) or combined abundance (R2 = 0.235, P = 0.079) with fencing age (Figure 7). However, native species abundance generally increased as a result of livestock exclusion fencing.
No relationship was found between fenced/unfenced differences in native species composition (R2 = 0.034, P = 0.529), exotic species composition (R2 = 0.156, P = 0.163) or combined species composition (R2 = 0.059, P = 0.402) with fencing age (Figure 8).
These results are consistent with the Null Model predictions.

Figure 5. Difference in exotic species richness between fenced and Figure 6. Difference in combined species richness with fencing age
unfenced with fencing age
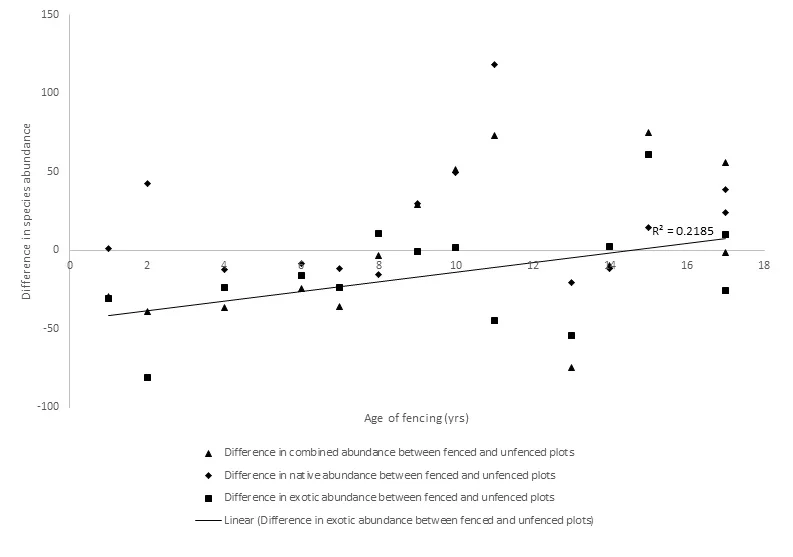
Figure 7. Difference in native, exotic and combined species abundances between fenced and unfenced plots with fencing age

Figure 8. Bray-Curtis dissimilarity between fenced and unfenced plots with fencing age
Woody Encroachment Model
No relationship was observed between fencing age and fenced/unfenced differences in woody plant density (R2 = 0.154, P = 0.165) or ground cover abundance (R2 = 0.222, P = 0.089).
No relationship was found between fenced/unfenced differences in groundcover richness and fencing age (R2 = 0.034, P = 0.529). No relationship was found between changes groundcover richness (R2 = 0.009, P = 0.749) or groundcover abundance (R2 = 0.001, P = 0.903) as a function of woody plant density (Figure 9 and 10, respectively).
These results are inconsistent with Woody Encroachment Model predictions.

Figure 9. Difference between woody plant density and groundcover Figure 10. Difference between woody plant density and groundcover abundance richness between fenced and unfenced plot between fenced and unfenced plots
Discussion
No evidence was found to support the Recovery Model, Competitive Exclusion Model or Woody Encroachment Model. However, the data did support Null Model predictions (the null model). Under this model the grazed system shows limited recovery after fencing to exclude livestock grazing and no consistent trend occurs in species richness, abundance or composition with fencing age. The null model is also supported by Schultz et al. (2014) and Lunt et al. (2007b). While the findings of Schultz are only relevant for the first 2.5 years, Lunt et al. (2007b) and the current study suggest that the lack of a trend may continue for at least the first 12-17 years after livestock exclusion.
Although native species richness did not consistently increase with time-since-livestock-exclusion in this study. Other studies in support of Recovery Model have been conducted in ecosystems shown to be resource poor (i.e. limited by water or nutrients) or only mildly degraded. A lack of support for Recovery Model here, may be explained by site productivity and degree of degradation. For example, rainfall of the study sites (594-805 mm per annum) is in the upper range of that of western slope grassy woodlands (Keith 2004). The sites occur on farming land and are loams and clay soils derived from basalt, granite and sedimentary shale, mud and sandstone. Study sites would conform to degraded vegetation states described in Spooner and Allcock (2006) that have crossed one ecological boundary (i.e. loss of propagules) and possibly a second (i.e. introduction of exotic pasture species and addition of nutrients). Landholder interviews revealed common usage of super phosphate, as well as introduction of exotic pasture species, which was also evident from the species composition data. The effects of topsoil phosphorus level and degree of degradation on species composition and soil recovery after livestock fencing are tested in Chapter 3. Sites that cross such boundaries require interventions in addition to grazing exclusion, such as direct seeding, supplementary plantings and amelioration of soil conditions to restore species diversity (Gibson-Roy et al. 2010; Prober et al. 2005).
Test results for the Competitive Exclusion Model suggest that fencing did not promote grass dominance and subsequent decline of smaller inter-tussock species richness. Although the tests failed to detect evidence that fencing promoted the recovery of inter-tussock plants over time, the data showed weak trends that may strengthen as more time elapses since livestock exclusion. Lunt and Morgan (1999) found that even after grazing had ceased for 10 years, total floristic richness increased only slightly due to addition of ruderal species. They concluded that even intermittent fire disturbance could not initiate recovery of original woodland flora that had been lost due to past grazing. Studies by Schultz et al. (2011) and Gibson and Kirkpatrick (1989) support the Competitive Exclusion Model. Both authors identify site productivity as the main factor responsible for competitive exclusion. As described above, the productivity of the sample sites is also considered relatively high. So why was the Competitive Exclusion Model undetected in the current study? Schultz et al. (2011) and Gibson and Kirkpatrick (1989) excluded large native herbivores from their fenced treatments; while the current study did not. The effects of uncontrolled native herbivore grazing has been highlighted as a confounding factor in other fencing studies (Price et al. 2010). Many of the fenced plots in the current study showed evidence of heavy grazing pressure imposed by native macropods. Alternatively, the measure of plant abundance employed here (frequency in 1 m2 quadrats) may have insufficient sensitivity to detect subtle plant responses. More sensitive measures of competition from dominant grasses, such as above-ground biomass or light penetration (Grace 1999) may reveal interactions predicted by the Competitive Exclusion Model.
A lack of support for Wood Encroachment Model could be due to slow rates of woody recruitment, which may require more than 17 years of grazing exclusion to detect in this system. Natural regeneration of woody plants, particularly eucalypts, require a series of coincident conditions. The first requirement is seed fall from proximal sources (Dorrough and Moxham 2005; Venning 1988). Eucalypts disperse the majority of their seed up to 1.5 times the height of parent trees (Lawrence et al. 1998) and their seeds do not persist in soils for long periods (Florence 2004). The second requirement is recent rainfall and favourable temperatures (Yates et al. 1996). Trees may not produce and release seed every year, and seed production may be influenced by the degree of site degradation or canopy defoliation by insect outbreaks, which occur periodically in fragmented box-gum woodlands (Landsberg et al. 1990). Thirdly, tree recruitment requires low seed predation (Yates et al. 1995), and finally, a suitable seed bed to facilitate the germination process (Faunt et al. 2006). Thus, tree regeneration may be highly episodic. The majority of study sites were open grasslands beyond the limits of seed fall from nearby trees. It is also possible that the events needed to promote woody plant recruitment are yet to coincide at the study sites. Curtis (1990) estimates that eucalypt recruitment conditions coincide only once every 10-20 years in the Northern Tablelands of NSW. If this is the case in the central tablelands, then study sites may need more time for recruitment conditions to occur. Given that most of the sites are degraded, dense tree recruitment may be limited by farming legacies, such as elevated soil nutrients and exotic dominant pastures.
Greater replication of sites may have detected stronger evidence of trends predicted by models. However, greater replication could only be achieved with trade-offs on other aspects of the experimental design, for example by reducing the minimum standard of acceptable cross-fence comparisons. In addition to the 14 sites selected for sampling more than 70 candidate sites were excluded from the study because management histories were unknown or inconsistent between fenced and unfenced areas. Increasing replication by accepting a lower standard for matching between fenced and unfenced plots, would reduce rather than increase the ability to detect trends. Space-for-time substitution sampling designs assume spatial and temporal variation are equivalent and, while commonly used in ecology, are sensitive to short term environmental fluctuations (Pickett 1989). Temporal sampling designs collect data over a longer time period which accounts for natural variation caused by the environment. Space-for-time sampling occurs over a much shorter time-frame which is sensitive to fluctuations in the environment; space-for-time studies are a smaller snapshot in time.
Sampling vegetation across multiple seasons would provide a better representation of true species richness of sites (Schultz et al. 2014). Seasonal sampling would also account below average rainfall, which may affect germination rates and reduce species richness. Some plant life-cycles’, including annual species and terrestrial orchids are dormant and undetectable in Autumn. This is particularly important when comparing degraded woodlands invaded by annuals to reference woodlands with cryptic species. Other variables that may explain the null model include limitations of seed dispersal from nearby seed sources. In a study of old-field recolonisation, Standish et al. (2007) found higher native species richness at old-field sites adjacent woodland remnants compared to old-field sites of greater distance from woodland remnants.
Even though the results showed no linear relationship between increases in native species richness or abundance with time-since-livestock-exclusion, native species richness and abundance was significantly greater in fenced plots compared to unfenced plots. Indeed, at most sites species richness and abundance was greater in the fenced plot, while at some sites, fenced and unfenced plots had similar values of richness. This suggests that some sites receive an immediate restoration benefit within 1-2 years of fencing and subsequently show limited progress, while other sites fail to respond. Although fencing may not always produce positive results, it rarely produces bad results by increasing losses of native species. At a landscape or regional level it therefore still serves as an effective management option with an occasional risk of no effect (Spooner and Briggs 2008).
The lack of support for the three alternative restoration models suggests that time-since-livestock-exclusion is a poor predictor of vegetation response, at least over the 17 years that the response could be observed. In fact, vegetation response was shown to be highly variable among sites and inconsistent through time. Other intrinsic site factors may be stronger predictors than time-since-livestock-exclusion itself. Therefore, livestock exclusion on its own may be insufficient to initiate the establishment of native woodland species and decline of exotic species in degraded woodlands for at least the first 17 years. Fencing in conjunction with a suite of other management actions, including weed control (to supress competitive exotic species), direct seeding (to supplement depleted seed banks) and active planting (to instantly increase native species richness) may produce a more rapid response (Prober et al. 2011b; Spooner et al. 2002; Yates and Hobbs 1997).
Read More: Part Three
Literature Cited
Al-Rowaily, S.L., El-Bana, M.I., Al-Bakre, D.A., Assaeed, A.M., Hegazy, A.K., Ali, M.B., 2015. Effects of open grazing and livestock exclusion on floristic composition and diversity in natural ecosystem of Western Saudi Arabia. Saudi Journal of Biological Sciences 22 (4), 430-437.
Beadle, N.C.W., 1981. The vegetation of Australia. Fischer, Stuttgart ; New York.
Briggs, S.V., Taws, N.M., Seddon, J.A., Vanzella, B., 2008. Condition of fenced and unfenced remnant vegetation in inland catchments in south-eastern Australia. Australian Journal of Botany 56 (7), 590-599.
Connell, J.H., Slatyer, R.O., 1977. Mechanisms of Succession in Natural Communities and Their Role in Community Stability and Organization. The American Naturalist 111 (982), 1119-1144.
Curtis, D., 1990. Natural Regeneration of Eucalypts in the New England Region, In Sowing the Seeds: Direct Seeding and Natural Regeneration Conference. Greening Australia.
Department of Environment Climate Change and Water NSW, 2010. National Recovery Plan for White Box - Yellow Box - Blakely’s Red Gum Grassy Woodland and Derived Native Grassland. Department of Environment, Climate Change and Water NSW, Sydney.
Dorrough, J., Moxham, C., 2005. Eucalypt establishment in agricultural landscapes and implications for landscape-scale restoration. Biological Conservation 123 (1), 55-66.
El-Bana, M.I., Nijs, I., Khedr, A.-H.A., 2003. The Importance of Phytogenic Mounds (Nebkhas) for Restoration of Arid Degraded Rangelands in Northern Sinai. Restoration Ecology 11 (3), 317-324.
Faunt, K., Geary, P., Cunningham, R., Gibbons, P., 2006. The East Gippsland Silvicultural Systems Project II: Germination and early survival of eucalypt regeneration. Australian Forestry 69 (3), 182-197.
Florence, R.G., 2004. Ecology and silviculture of eucalypt forests. CSIRO publishing, Collingwood.
Gibson-Roy, P., Moore, G., Delpratt, J., Gardner, J., 2010. Expanding horizons for herbaceous ecosystem restoration: the Grassy Groundcover Restoration Project. Ecological Management & Restoration 11 (3), 176-186.
Gibson, N., Kirkpatrick, J., 1989. Effects of the Cessation of Grazing on the Grasslands and Grassy Woodlands of the Central Plateau, Tasmania. Australian Journal of Botany 37 (1), 55-63.
Grace, J.B., 1999. The factors controlling species density in herbaceous plant communities: an assessment. Perspectives in Plant Ecology, Evolution and Systematics 2 (1), 1-28.
Harrington, G.N., Oxley, R.E., Tongway, D.J., 1976. The Effects of European Settlement and Domestic Livestock on the Biological System in Poplar Box (Eucalyptus populnea) Lands. The Rangeland Journal 1 (4), 271-279.
Hodgkinson, K.C., 1976. The Shrubs of Poplar Box (Eucalyptus populnea) Lands and their Biology. The Rangeland Journal 1 (4), 280-293.
Huston, M., 1979. A general hypothesis of species diversity. American Naturalist81-101.
Jones, C.S., Duncan, D.H., Rumpff, L., Thomas, F.M., Morris, W.K., Vesk, P.A., 2015. Empirically validating a dense woody regrowth ‘problem’ and thinning ‘solution’ for understory vegetation. Forest Ecology and Management(0).
Keith, D.A., 2004. Ocean Shores to Desert Dunes: The Native Vegetation of New South Wales and the ACT. Department of Environment and Conservation (NSW).
KrÖPfl, A.I., Cecchi, G.A., Villasuso, N.M., Distel, R.A., 2013. Degradation and recvoery processes in semi-arid patchy rangelands of northern Patagonia, Argentina. Land Degradation & Development 24 (4), 393-399.
Landsberg, J., Morse, J., Khanna, P., 1990. Tree dieback and insect dynamics in remnants of native woodlands on farms. Australian ecosystems: Proc. symposium, Geraldton, W.A., 1988149-165.
Lawrence, J., Semple, W.S., Koen, T.B., 1998. Experimental attempts at encouraging eucalypt regeneration in non-native pastures of northern Victoria and central western NSW. Proceedings of The Linnean Society of New South Wales 119.
Lunt, I.D., Eldridge, D.J., Morgan, J.W., Witt, G.B., 2007a. TURNER REVIEW No. 13 A framework to predict the effects of livestock grazing and grazing exclusion on conservation values in natural ecosystems in Australia. Australian Journal of Botany 55 (4), 401-415.
Lunt, I.D., Jansen, A., Binns, D.L., Kenny, S.A., 2007b. Long-term effects of exclusion of grazing stock on degraded herbaceous plant communities in a riparian Eucalyptus camaldulensis forest in south-eastern Australia. Austral Ecology 32 (8), 937-949.
Lunt, I.D., Morgan, J.W., 1999. Vegetation Changes after 10 Years of Grazing Exclusion and Intermittent Burning in a <i>Themeda triandra</i> (Poaceae) Grassland Reserve in South-eastern Australia. Australian Journal of Botany 47 (4), 537-552.
Mack, R.N., Thompson, J.N., 1982. Evolution in Steppe with Few Large, Hooved Mammals. The American Naturalist 119 (6), 757-773.
Moore, C.W.E., 1953. The vegetation of the south-eastern Riverina, New South Wales. I. The climax communities. Australian Journal of Botany 1 (3), 485-547.
Oksanen, J., Blanchet, F.G., Kindt, R., Legendre, P., Minchin, P.R., O'Hara, R.B., Simpson, G.L., Solymos, P., Stevens, M.H.H., Wagner, H., 2015. vegan: Community Ecology Package. R package version 2.3-0.
Pettit, N.E., Froend, R.H., 2001. Long-term changes in the vegetation after the cessation of livestock grazing in Eucalyptus marginata (jarrah) woodland remnants. Austral Ecology 26 (1), 22-31.
Pettit, N.E., Froend, R.H., Ladd, P.G., 1995. Grazing in remnant woodland vegetation: changes in species composition and life form groups. Journal of Vegetation Science 6 (1), 121-130.
Pickett, S.A., 1989. Space-for-Time Substitution as an Alternative to Long-Term Studies, In Long-Term Studies in Ecology. (ed. G. Likens), pp. 110-135. Springer New York.
Price, J.N., Morgan, J.W., 2009. Multi-decadal increases in shrub abundance in non-riverine red gum (Eucalyptus camaldulensis) woodlands occur during a period of complex land-use history. Australian Journal of Botany 57 (3), 163-170.
Price, J.N., Wong, N.K., Morgan, J.W., 2010. Recovery of understorey vegetation after release from a long history of sheep grazing in a herb-rich woodland. Austral Ecology 35 (5), 505-514.
Prober, S., 1996. Conservation of the Grassy White Box Woodlands: Rangewide Floristic Variation and Implications for Reserve Design. Australian Journal of Botany 44 (1), 57-77.
Prober, S.M., Lunt, I.D., Thiele, K.R., 2002a. Determining reference conditions for management and restoration of temperate grassy woodlands: relationships among trees, topsoils and understorey flora in little-grazed remnants. Australian Journal of Botany 50 (6), 687-697.
Prober, S.M., Standish, R.J., Wiehl, G., 2011a. After the fence: Vegetation and topsoil condition in grazed, fenced and benchmark eucalypt woodlands of fragmented agricultural landscapes. Australian Journal of Botany 59 (4), 369-381.
Prober, S.M., Standish, R.J., Wiehl, G., 2011b. After the fence: vegetation and topsoil condition in grazed, fenced and benchmark eucalypt woodlands of fragmented agricultural landscapes. Australian Journal of Botany 59 369-381.
Prober, S.M., Thiele, K.R., 1993. The ecology and genetics of remnant grassy white box woodlands in relation to their conservation. Victorian Naturalist 110 (1), 30-36.
Prober, S.M., Thiele, K.R., Lunt, I.D., 2002b. Identifying ecological barriers to restoration in temperate grassy woodlands: soil changes associated with different degradation states. Australian Journal of Botany 50 (6), 699-712.
Prober, S.M., Thiele, K.R., Lunt, I.D., Koen, T.B., 2005. Restoring ecological function in temperate grassy woodlands: manipulating soil nutrients, exotic annuals and native perennial grasses through carbon supplements and spring burns. Journal of Applied Ecology 42 (6), 1073-1085.
R Core Team, 2016. R: A language and environment for statistical computing. R Foundation for Statistical Computing, Vienna, Austria.
Schultz, N.L., Morgan, J.W., Lunt, I.D., 2011. Effects of grazing exclusion on plant species richness and phytomass accumulation vary across a regional productivity gradient. Journal of Vegetation Science 22 (1), 130-142.
Schultz, N.L., Reid, N., Lodge, G., Hunter, J.T., 2014. Seasonal and interannual variation in vegetation composition: Implications for survey design and data interpretation. Austral Ecology 39 (7), 755-766.
Specht, R.L., 1981. Conservation of vegetation types, In Australian Vegetation. (ed. H. Groves), pp. 394-410. Cambridge University Press, Cambridge.
Spooner, P., Lunt, I., Robinson, W., 2002. Is fencing enough? The short-term effects of stock exclusion in remnant grassy woodlands in southern NSW. Ecological Management & Restoration 3 (2), 117-126.
Spooner, P.G., Allcock, K.G., 2006. Using a State-and-Transition Approach to Manage Endangered Eucalyptus albens (White Box) Woodlands. Environmental Management 38 (5), 771-783.
Spooner, P.G., Briggs, S.V., 2008. Woodlands on farms in southern New South Wales: A longer-term assessment of vegetation changes after fencing. Ecological Management & Restoration 9 (1), 33-41.
Standish, R.J., Cramer, V.A., Wild, S.L., Hobbs, R.J., 2007. Seed dispersal and recruitment limitation are barriers to native recolonization of old-fields in western Australia. Journal of Applied Ecology 44 (2), 435-445.
Su, H., Liu, W., Xu, H., Wang, Z., Zhang, H., Hu, H., Li, Y., 2015. Long-term livestock exclusion facilitates native woody plant encroachment in a sandy semiarid rangeland. Ecology and Evolution 5 (12), 2445-2456.
Tremont, R., 1994. Life-History Attributes of Plants in Grazed and Ungrazed Grasslands on the Northern Tablelands of New South Wales. Australian Journal of Botany 42 (5), 511-530.
Tunstall, B.R., Torsell, B.W.R., Moore, R.M., Robertson, J.A., Goodwin, W.F., 1981. Vegetation change in a Poplar Box (<i>Eucalyptus populnea</i>) Woodland. Effects of tree killing and domestic livestock. The Rangeland Journal 3 (2), 123-132.
Venning, J., 1988. Growing trees for farms, parks and roadsides : a revegetation manual / Julianne Venning. Lothian, Melbourne.
Wahren, C., Papst, W., Williams, R., 1994. Long-Term Vegetation Change in Relation to Cattle Grazing in Sub-Alpine Grassland and Heathland on the Bogong High-Plains: an Analysis of Vegetation Records From 1945 to 1994. Australian Journal of Botany 42 (6), 607-639.
Whalley, R.D.B., 1994. State and transition models for rangelands. 1. Successional theory and vegetation change. Tropical Grasslands 28 195–205.
Whittaker, R.H., 1975. Communities and ecosystems. Macmillan, New York.
Yates, C.J., Hobbs, R.J., 1997. Woodland restoration in the Western Australian wheatbelt: a conceptual framework using a state and transition model. Restoration Ecology 5 (1), 28-35.
Yates, C.J., Hobbs, R.J., 1999. Temperate eucalypt woodlands in Australia- an overview, In Temperate Eucalypt Woodlands in Australia. (ed. Hobbs RJ and Yates CJ), pp. 1-5. Surrey Beattie and Sons, Chipping Norton.
Yates, C.J., Hobbs, R.J., Atkins, L., 2000. Establishment of perennial shrub and tree species in degraded Eucalyptus salmonophloia (salmon gum) remnant woodlands: Effects of restoration treatments. Restoration Ecology 8 (2), 135-143.
Yates, C.J., Hobbs, R.J., Bell, R.W., 1994. Landscape-scale Disturbances and Regeneration in Semi-arid Woodlands of Southwestern Australia. Pacific Conservation Biology 1 (3), 214-221.
Yates, C.J., Hobbs, R.J., Bell, R.W., 1996. Factors limiting the recruitment of Eucalyptus salmonophloia in remnant woodlands. III. Conditions necessary for seed germination. Australian Journal of Botany 44 (3), 283-296.
Yates, C.J., Taplin, R., Hobbs, R.J., Bell, R.W., 1995. Factors limiting the recruitment of Eucalyptus salmonophloia in remnant woodlands: II. Post-dispersal seed predation and soil seed reserves. Australian Journal of Botany 43 (2), 145-155.
Yeo, J.J., 2005. Effects of grazing exclusion on rangeland vegetation and soils, East Central Idaho. Western North American Naturalist91-102.